

Ask five different sources how much a landscaping company should spend on marketing, and you’ll get five different answers. One says 1% to 2% of revenue. Another says 7% to 12%. A third recommends monthly dollar figures that have nothing to do with revenue at all. None of this is dishonest. It’s just incomplete, because a landscaping marketing budget isn’t one number. It’s a range that depends on where your business actually stands, and most guides skip straight past that part.
This matters more than it sounds like it should. Set the number too low while you’re trying to grow, and you’ll stay invisible in a market where most customers never call the second company they find. Set it too high while you’re established and already full of repeat work, and you’re funding growth you don’t need. The right number isn’t a guess. It’s a calculation, and this guide walks through how to make it.
Landscaping Marketing Budget: Why the Numbers Disagree
The recommended spend ranges from 1% to 20% of revenue, depending on who you ask. At one end, 2026 industry data puts marketing spend for the largest, most established landscaping businesses at 1% to 2% of revenue. At the other end, the same data set recommends 7% to 12% for most companies, climbing to 15% in competitive markets, and as high as 20% for a company under two years old. Both figures are accurate; they’re just describing different businesses.
The factor that explains the gap is business stage, not industry averages or regional differences. A landscaping company doing $10 million a year, with a full book of repeat clients and a strong referral pipeline, doesn’t need to spend the same way a brand-new company does. A business under two years old is usually starting with few or no repeat customers, so almost every job it books has to come from new marketing efforts. The established company is defending market share it already has. The new company is buying market share it doesn’t have yet, and that costs more, proportionally, every time.
A second factor compounds the first: how much of your revenue already comes from repeat customers and referrals. A company with a high repeat-customer share can spend less on acquisition because its existing client base is doing part of the marketing job for free. A company still building that base has to pay for every new customer directly, which pushes its percentage higher even at the same revenue level.
So when a guide says “1% to 2%,” it’s usually describing a large, established operator. When another says “12% to 20%,” it’s usually describing a new or growth-stage company. Neither is wrong. The mistake is applying either number to a business that doesn’t match the profile behind it.
The Real Framework: Stage, Not Just Revenue
Instead of picking a single percentage, start by identifying which of three stages your business is actually in, based on the same 2026 industry data referenced above:
- Maintain stage: 5% to 8% of revenue. This fits an established company with a strong repeat-customer base and a steady lead flow from referrals and reviews. The goal here is defending position, not chasing growth, so the budget stays lean.
- Growth stage: 8% to 12% of revenue, rising to 15% in a competitive local market. This fits a company that’s actively expanding, whether that means adding service lines, moving into new zip codes, or hiring a bigger crew. In that situation, the business has to win new customers faster than it loses existing ones, just to grow instead of standing still.
- New-company stage: 12% to 20% of revenue. This fits a business under roughly two years old that hasn’t built a referral engine yet and needs to buy nearly all of its early customer volume.
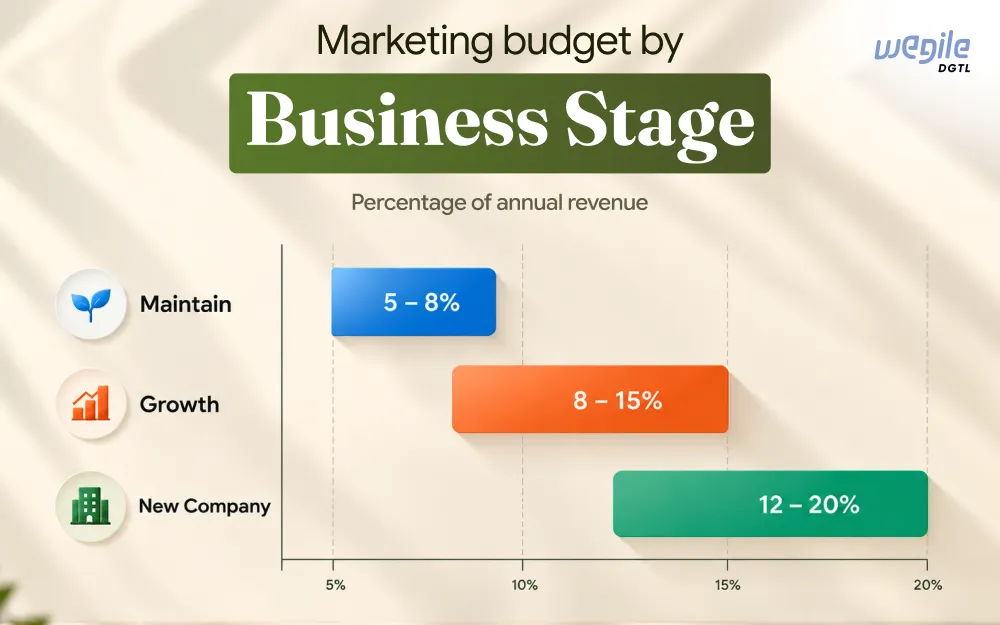
One more thing affects this: company size itself. A very large, mature landscaping company (say, $10 million a year or more) often ends up spending only 1% to 2% of revenue on marketing. That’s not because the framework above is wrong, it’s simple math. The same dollar amount of marketing spend is a much smaller percentage of a $10 million company’s revenue than it would be for a smaller company. On top of that, these large companies usually have the highest repeat-customer share of anyone, so they need less marketing to win new customers in the first place. This is still the maintain-stage pattern from above, just showing up at the largest end of the revenue scale.
What a Landscaping Lead Actually Costs
Picking a percentage only gets you half the answer. You also need a realistic sense of what each lead actually costs, because that’s what turns a budget into a number of jobs you can expect to book.
That same 2026 industry data, compiling data from three separate sources, shows just how much this varies:
- LocaliQ’s 2025 landscaping data, drawn from thousands of live Google Ads accounts, puts cost per lead at $117.92, with a 6.42% conversion rate.
- Evergrow Marketing’s green-industry client data puts it lower, at $85.48, down slightly from the year before.
- PPC Chief’s 2026 modeled estimate lands lowest, at $49.09, with a working range of $37 to $66.
None of these numbers is “wrong.” They’re measuring different samples, from live accounts of varying size to one agency’s client book to a modeled estimate, and real cost per lead also shifts with the season. Spring and early summer bring the heaviest demand for landscaping services, and every competitor is bidding harder for the same searches at the same time, which pushes cost per lead toward the top of the range. Late fall and winter see less competition and often a lower cost per lead, but also far fewer people searching at all, so the lower cost doesn’t necessarily mean a better return. The practical takeaway isn’t to anchor on one figure. It’s to expect your actual cost per lead to fall somewhere in that $37 to $118 range depending on your market and the time of year, and to budget with that range in mind rather than a single assumed number.
Where the Budget Should Actually Go
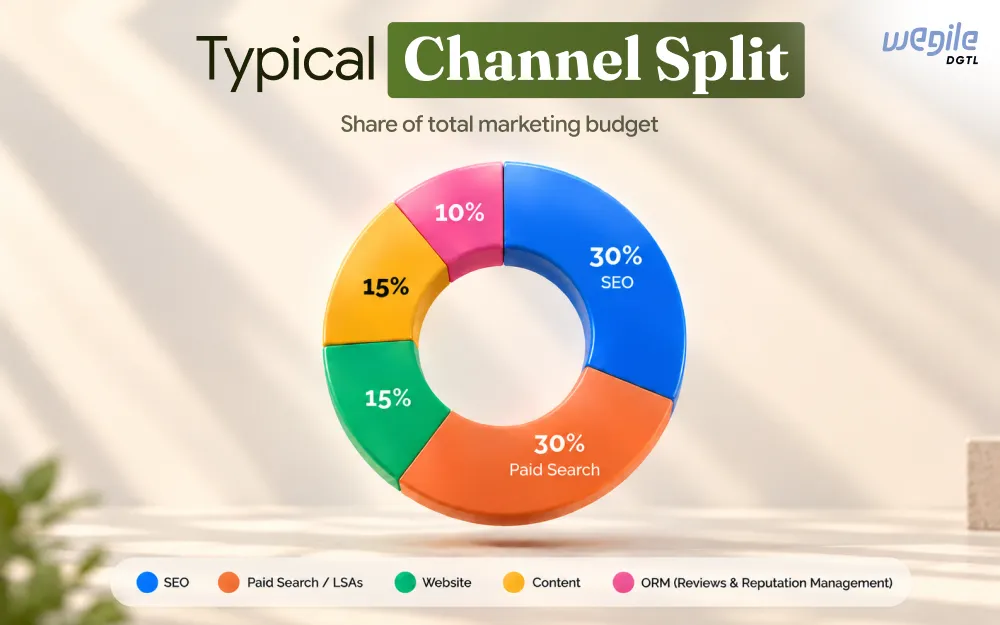
Once you know your overall number, the next question is how to split it. That same data breaks down a typical landscaping marketing budget by channel:
- SEO and organic search: 25% to 35% of the total budget.
- Paid search and Local Services Ads: 25% to 35% of the total budget.
- Website and conversion optimization: 10% to 20% of the total budget.
- Content: 10% to 15% of the total budget.
- ORM (Online Reputation Management): 5% to 10% of the total budget.
Two channels that don’t show up in that breakdown are still worth a line item for most landscaping companies. The first is a referral program that actively asks satisfied customers for introductions rather than waiting for word of mouth to happen on its own; a repeat customer who’s already been asked tends to refer more often than one who hasn’t. The second is direct mail into dense residential routes. It sounds dated next to paid search and AI-driven discovery, but for a business whose service area is geographically concentrated, mailing a tight radius around existing job sites is still one of the cheaper ways to reach a household that’s likely to become a repeat customer for years.
The split above is a reasonable starting point for most stages. But one part of it is shifting fast enough in 2026 that it deserves its own section.
How AI Search Is Changing That Split in 2026
Search behavior for local services has changed quickly over the past year, which changes how the budget split above should be weighted. According to BrightLocal’s 2026 consumer research, the share of consumers using AI tools like ChatGPT to find and get recommendations for local businesses rose from 6% in 2025 to 45% in 2026, making AI tools the third most common way people now discover local services.
For a landscaping company, that shift has a direct budget consequence. When a customer asks an AI tool for a recommendation, it pulls its answer from a company’s online presence: its reviews, its service descriptions, how clearly its website explains what it does and where it operates, and whether its Google Business Profile is complete and accurate. Maintaining that presence is local SEO and reputation work, not paid advertising. A budget split that was built around 2023 or 2024 search behavior, when organic rankings and paid ads were the two channels that mattered, under-weights the SEO and ORM portion of the split for a 2026 customer journey that increasingly starts with an AI-generated recommendation instead of a list of search results.
A Real Result: What Disciplined Budget Allocation Can Do
A framework is only useful if it actually works. One of the clearest examples we’ve worked on directly is Elevated Seasons, a landscape lighting and landscaping client whose results are detailed on our landscaping industry page.
Over a two-year partnership, we rebuilt the brand, ran Google Search and Performance Max campaigns, and built out an SEO strategy alongside both. The combined result: an 8.76x return on marketing investment over the two years, an 11.26x return on ad spend specifically, a cost per lead 2.28 times lower than where the client started, and a customer acquisition cost 3.82 times lower.
The result didn’t come from spending more in isolation. It came from combining SEO, brand work, and paid search deliberately within one coordinated strategy, rather than treating each one as its own separate budget, disconnected from the others. That’s the same principle behind the stage-based framework above: the right split, applied consistently, compounds.
Setting Your Own Number
With the framework, the cost data, and the channel split above, here’s how to work out an actual number for how much your landscaping company should spend on marketing.
- Identify your stage. Are you maintaining an established, mostly repeat-customer business, actively growing into new territory or service lines, or still building your customer base in your first two years?
- Apply the matching percentage. Maintain stage: 5% to 8% of revenue. Growth stage: 8% to 12%, up to 15% in a competitive market. New-company stage: 12% to 20%.
- Multiply that percentage by your annual revenue to get a total marketing budget figure.
- Sanity-check it against cost per lead. Divide your budget by a realistic cost-per-lead estimate for your market (somewhere in the $37 to $118 range from the data above) to see roughly how many leads that budget should generate, then compare that to how many new customers you actually need this year. Treat that range as the mature average, not what you’ll see in the first month or two. A new paid campaign usually costs more per lead at the start, since the platform hasn’t learned your audience yet, and new SEO or content work takes time to build up the authority that eventually brings the cost down. Budget for a higher cost per lead early on, and expect it to settle toward the benchmark range as the campaign and the content mature. If the math doesn’t produce enough leads to hit your growth goal, your percentage needs to move toward the higher end of your stage’s range.
- Split the total using the channel breakdown, weighting SEO, content, and ORM toward the higher end given how much local search behavior has shifted toward AI-driven recommendations.
Here’s what that looks like worked through for a growth-stage company doing $2 million in annual revenue. At 10% of revenue, the total marketing budget comes to $200,000 for the year. At a blended cost per lead of roughly $75, that budget should generate around 2,660 leads over the year, unevenly distributed toward spring and summer. Split across channels, that’s roughly $66,000 toward SEO and organic search, $54,000 toward paid search and Local Services Ads, $30,000 toward the website and conversion work that turns those leads into booked jobs, $30,000 toward content, and $20,000 toward ORM. SEO, content, and ORM sit toward the higher end of their ranges here (33%, 15%, and 10%), while paid search sits toward the lower end of its range (27%), for the reasons covered above.
Work out your own number
The same five steps, done for you. Defaults match the $2 million growth-stage example above.
5. Channel split
Weighted like the example above, with SEO, content, and ORM toward the higher end of their ranges.
Final Thoughts
Your business stage decides this number more than anything else, and that’s exactly what a flat percentage leaves out: your stage, your repeat-customer share, and your real cost per lead all change what the right number looks like. A maintenance-stage company spending 6% of revenue and a new company spending 18% can both be budgeting correctly, for their own situation.
What doesn’t change is the discipline behind the number. Pick your stage honestly, size the budget to match it, and split that budget across SEO, paid search, your website, content, and ORM in a way that reflects how customers actually find landscaping companies today. Once you’ve set the overall figure, the next practical question is usually how much of it should go specifically toward paid ads, which we cover in sizing your first ad budget.
Want help setting the number and the split for your own company?
See Wegile DGTL for landscaping